
What Is Price Action Trading? Meaning, Strategies and Examples

What Is Price Action Trading? Meaning, Strategies and Examples
 admin
Technical Analysis Guide | Beginner to Intermediate
Last updated: 14 November 2026
When you open a stock chart, the first thing you see is price moving up, down or sideways. But those movements also tell a story: where buyers stepped in, where sellers became active, where a move lost strength and where the market struggled to make progress. Price action trading is the practice of studying those price movements to understand market behaviour and plan trades.
Instead of depending mainly on a collection of indicators, a price action trader studies candlesticks, swing highs and lows, market structure, support and resistance zones, and often volume. This guide explains how the approach works, how beginners can read a chart, which common setups traders study, and why risk management matters just as much as an entry signal.
In This Guide
- What is price action trading?
- How does price action trading work?
- Core elements of price action analysis
- Price action vs indicator-based trading
- Common price action trading strategies
- How to start: a step-by-step process
- Risk management and position sizing
- Which chart timeframe should you use?
- Advantages and limitations
- Common mistakes to avoid
- Frequently asked questions
What Is Price Action Trading?
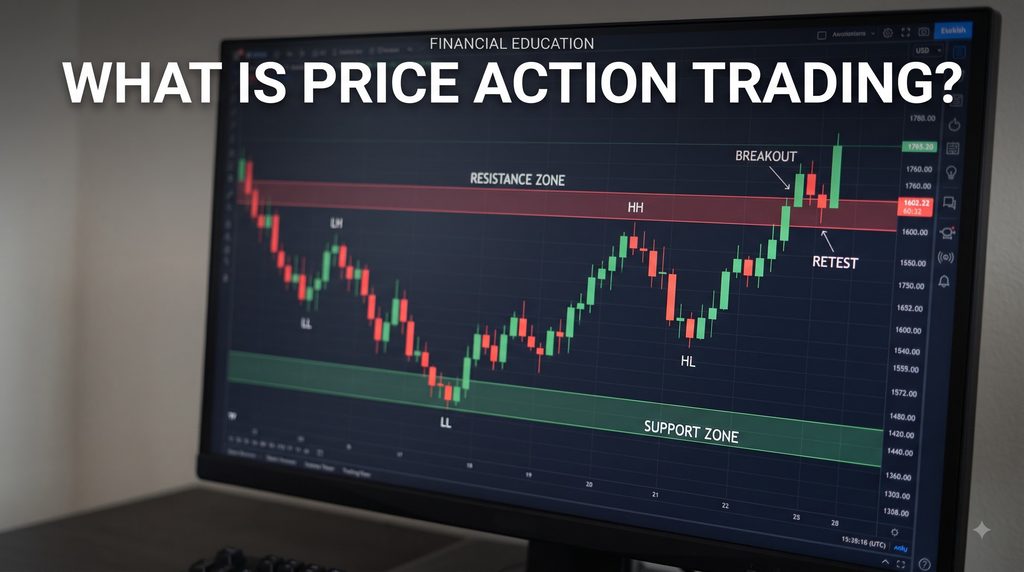
Price action trading is a method of analysing a financial market by observing changes in its price over time. Traders use the information visible on a price chart—such as open, high, low and close (OHLC), candlestick formations, swing points, trend structure and reactions around important price zones—to form a trading plan.
For example, imagine a stock repeatedly finds buyers around ₹500 and struggles to move above ₹530. A price action trader may mark ₹500 as a potential support area and ₹530 as a potential resistance area. If the stock later moves above ₹530 and holds that level on a retest, the trader may study whether a breakout setup is developing. If it quickly falls back below the level, the breakout may have failed.
The important point is that price action does not tell a trader exactly what will happen next. It gives a framework for reading what the market is doing now, identifying possible scenarios and deciding in advance where a trade idea would no longer make sense.
Price action is part of technical analysis. Some traders prefer a clean chart with very few indicators, sometimes called a naked chart. Others combine price action with volume, moving averages or other tools. There is no requirement that every price action trader must use exactly the same chart setup.
How Does Price Action Trading Work?
Every completed candle records the prices reached during a particular period. A one-minute candle summarises one minute of trading; a daily candle summarises a full trading day. By studying how candles form in relation to earlier price levels, a trader tries to understand whether buyers or sellers appear to be in control.
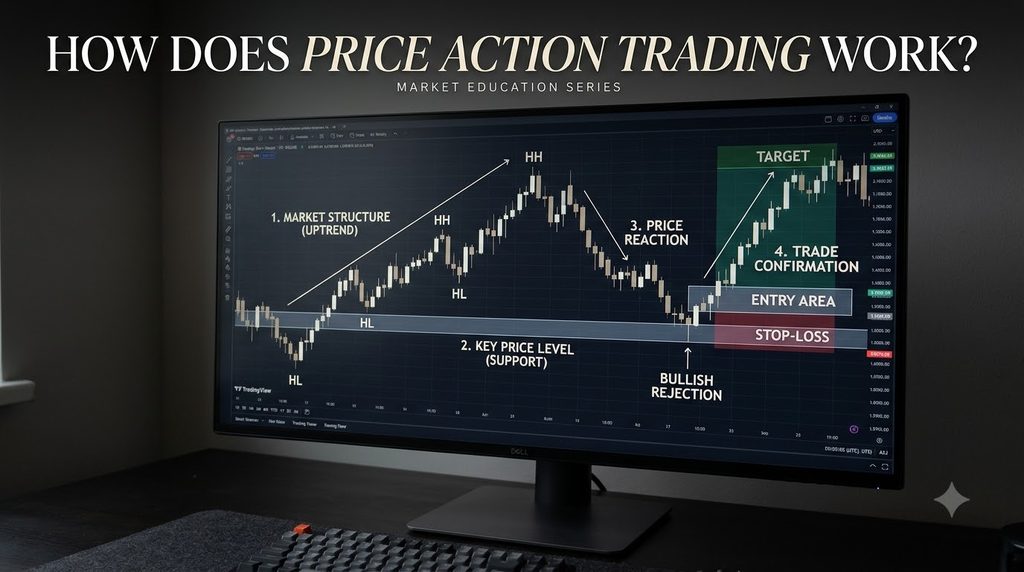
A practical price action reading usually follows this sequence:
- Read the broader structure. Is price making higher highs and higher lows, lower highs and lower lows, or moving inside a range?
- Mark important areas. Note recent swing highs and lows, previous support and resistance zones, and the boundaries of a consolidation.
- Observe the reaction. Does price reject the area, pause, break through it, or return to test it?
- Look for confirmation. A candle close, follow-through movement or a relevant change in volume may add context. One candle alone is not proof.
- Plan the risk before entering. Decide the entry condition, the level that invalidates the idea, the position size and a realistic exit plan.
In other words, price action trading is not simply spotting a hammer or engulfing candle and placing an order. The location of the pattern, the preceding trend, the wider market condition and the amount at risk all matter.
Core Elements of Price Action Analysis
1. Candlestick charts and OHLC
A candlestick displays four prices for its selected timeframe: open, high, low and close. The thick part is called the real body; the thin lines above and below it are commonly called wicks or shadows. A candle is generally shown as bullish when its close is above its open and bearish when its close is below its open. Chart colours can be changed by the user, so read the open and close values rather than relying only on colour.
A long body can show a larger difference between the opening and closing prices for that period. A long upper wick shows that price traded higher but did not hold the high by the close; a long lower wick shows that price traded lower but recovered before the close. These are clues about that candle’s trading range—not guarantees of a reversal.
Common candle terms include Doji, Hammer, Shooting Star and Engulfing. Learn what the candle communicates, but always read it alongside the preceding trend and the level where it appears. Zerodha Varsity’s chart-types lesson explains how OHLC information is represented on different charts.
2. Market structure: higher highs and lower lows
Market structure is the sequence of important swing highs and swing lows.
- Uptrend: price generally forms higher highs (HH) and higher lows (HL). Buyers are managing to push price to new highs while pullbacks are finding support at progressively higher areas.
- Downtrend: price generally forms lower highs (LH) and lower lows (LL). Attempts to recover are failing at lower areas, while sellers continue to push price down.
- Sideways market: price moves between a relatively defined upper and lower area without a clear sequence of higher highs or lower lows.
A single new high does not automatically confirm a lasting uptrend, and a single lower low does not guarantee that a downtrend will continue. Traders look at the sequence and quality of swings, the timeframe and the reaction around important levels.
3. Support and resistance zones
Support is an area where buying interest has previously appeared strongly enough to slow or interrupt a decline. Resistance is an area where selling pressure has previously slowed or interrupted a rise. These are better treated as zones rather than perfectly precise prices because orders are spread across a range and market reactions are rarely identical each time.
Traders commonly study previous swing highs and lows, repeated turning areas, range boundaries and important previous-session levels. A level that has produced several meaningful reactions may deserve attention, but repeated tests can also weaken a zone. There is no rule that a level must hold simply because it worked in the past.
For a deeper explanation, see Zerodha Varsity’s guide to support and resistance.
4. Breakouts, breakdowns and retests
A breakout occurs when price moves above a resistance area or the upper boundary of a range. A breakdown occurs when price moves below a support area or the lower boundary of a range. Traders often wait for a candle close beyond the level instead of reacting to a brief move through it.
After a breakout, price may return to test the level it has crossed. If the former resistance area begins acting as support, it can strengthen the breakout idea. The reverse can happen after a breakdown. However, a retest is not compulsory, and a level can fail. A move that quickly returns into the old range is commonly called a false breakout or false breakdown.
5. Volume as supporting information
Volume shows how many shares or contracts were traded during a period. It does not reveal the identity or intention of every buyer and seller, but it can help a trader judge how much participation accompanied a price move.
- A breakout accompanied by higher-than-usual volume may show broader participation than a breakout on unusually quiet volume.
- A pullback on lower volume may suggest that the counter-move has less participation, although this is not a rule.
- Heavy volume with little price progress can signal that the market is meeting opposing interest around that area.
Compare volume with the instrument’s recent activity and interpret it alongside price. High volume does not automatically mean bullishness, and low volume does not automatically mean a move will fail. NSE Academy also treats price and volume as fundamental inputs for studying market activity in its technical analysis and chart-pattern learning material.
Price Action Trading vs Indicator-Based Trading
Price action and technical indicators are not two completely separate subjects. Both can be used within technical analysis. The difference is mainly what the trader gives most attention to.
| Area | Price action-focused approach | Indicator-focused approach |
|---|---|---|
| Main input | Direct price movement, OHLC candles and swing structure | Calculated values derived from price, volume or both |
| Common tools | Candlesticks, support/resistance, trendlines, breakouts and volume | RSI, MACD, moving averages, Bollinger Bands and other indicators |
| Typical chart setup | Often relatively uncluttered | May include several plotted indicators or panels |
| Main challenge | Interpretation can be subjective; traders may mark different levels | Signals can lag, conflict or behave differently in different market conditions |
Neither approach is automatically better. A trader can use price structure to identify the setup and an indicator as an additional filter. The useful question is not how many tools are on the chart; it is whether the method has clear rules that can be tested and followed consistently.
Common Price Action Trading Strategies
The following are widely studied chart-reading setups. They are educational examples, not instructions to buy or sell a particular security. A setup can fail, and every trader should test rules on historical data and in simulated trading before risking capital.
1. Trend pullback strategy
In an established uptrend, price may rise, pull back towards a previous swing area and then attempt to move higher again. A trader may watch for the pullback to slow near a support zone and for price to show renewed buying interest—for example, by closing strongly above a nearby candle high.
In a downtrend, the process is reversed: price may recover towards a resistance area and then show renewed selling pressure. The idea is to study a possible continuation in the direction of the broader structure rather than chase every candle. The setup is invalidated if price breaks the structure on which the trade idea depended.
2. Breakout and retest strategy
Suppose a stock has repeatedly struggled near ₹530 and spends several sessions trading below that area. A trader may wait for price to close above the range, then observe whether it can hold the ₹530 area on a later pullback. A sustained move above the range, followed by a successful retest, may provide a clearer setup than reacting to the first intraday spike.
The opposite process can occur below support. The trader should define what would count as a failed breakout, where the idea is invalidated and how much can be lost before entering.
3. Support or resistance rejection
In this approach, a trader watches how price behaves after reaching a previously important zone. A long lower wick followed by a stronger close near support may indicate that lower prices were rejected during that candle. A long upper wick near resistance may show that buyers could not hold the higher prices.
A wick by itself is not an entry signal. Traders may wait for a follow-through candle, a break of a nearby swing point or another confirmation that fits their written rules. A zone can also break decisively, so a stop and invalidation level must be planned before entry.
4. Inside-bar or consolidation breakout
An inside bar is a candle whose high and low remain within the range of the preceding candle, often called the mother bar. It can reflect a temporary pause or contraction in price movement. Some traders study a break above the mother bar’s high or below its low as a possible directional move.
Inside bars appear in both trending and sideways markets. The direction of the break, the broader structure, the nearby support and resistance areas and the quality of follow-through matter more than the pattern name.
How to Start Price Action Trading: A Step-by-Step Process
- Learn the chart basics. Understand OHLC candles, wicks, bodies, timeframes and traded volume before trying to memorise advanced patterns.
- Choose one liquid instrument to study. Begin with a stock or index that has adequate liquidity and reliable chart data. Avoid switching between dozens of symbols while learning.
- Start with the higher timeframe. Check whether the broader chart is trending or ranging. Mark only the most relevant swing highs, swing lows and zones.
- Move to your working timeframe. Look for a specific setup, such as a trend pullback, a breakout-retest or a rejection at a key zone.
- Write down the conditions. Define what must happen before entry, what would invalidate the idea, where the initial stop belongs and how the trade will be managed.
- Calculate position size. Work out the rupee amount at risk and the quantity that fits that amount. Do not choose quantity first and then hope the stop is affordable.
- Practise and review. Use chart replay or paper trading. Save screenshots, record whether the rules were followed and review a meaningful sample of trades before drawing conclusions.
Beginners may find it useful to first understand the broader market structure. Trade4Wealth’s Stock Market for Beginners guide covers foundational concepts before moving into chart-based analysis.
Risk Management in Price Action Trading
A good-looking chart setup can still lose money. Price may reverse, break a level, gap beyond a stop or move so quickly that the actual execution price differs from the planned price. Risk management cannot remove these possibilities, but it can help a trader keep a single trade from taking an unnecessarily large share of available capital.
Plan the stop-loss around the trade idea
A stop-loss should be placed at a level that makes sense for the setup, not at an arbitrary point simply because the number feels comfortable. For example, if a long trade depends on a support zone holding, a sustained move below the relevant swing low may invalidate that idea. Volatility, instrument liquidity and the timeframe also matter.
Understand position sizing
A simplified position-sizing formula for a long trade is:
Position quantity = Maximum rupee risk ÷ (Entry price − Stop-loss price)
For illustration only, assume a trader has ₹1,00,000 of capital and chooses a hypothetical maximum risk of 0.5% of capital on one trade. That equals ₹500. If the planned entry is ₹250 and the stop-loss is ₹245, the price difference is ₹5 per share. The simplified quantity would be ₹500 ÷ ₹5 = 100 shares.
This is only a teaching calculation. Brokerage, taxes, exchange charges, slippage, liquidity and gaps can increase the actual loss. The example is not a recommended risk percentage or a recommendation to trade any security.
For a fuller explanation, read Trade4Wealth’s guide to risk management, stop-losses and position sizing. Traders considering futures and options should also understand the additional risks of derivatives. SEBI’s investor resource explains how derivatives work and the risks involved.
Which Timeframe Is Best for Price Action Trading?
There is no single best timeframe for every trader. The right chart depends on the instrument, trading plan, holding period, available time and ability to manage risk. A one-minute chart shows more short-term movement, but it also contains more noise. A daily chart filters much of that intraday movement but may not suit a trader seeking a very short holding period.
- Intraday trading: Traders may examine 5-minute, 15-minute or other intraday charts, while checking a higher timeframe for context. Short-term charts can move quickly and may be affected by spread, slippage and sudden volatility.
- Swing trading: Daily charts are commonly used to study moves that may last several sessions or longer. Weekly charts can help show the broader structure.
- Positional trading: Weekly and monthly charts may be useful for understanding longer-term price structure. Overnight and broader market risks remain relevant.
Use a consistent process instead of changing timeframes whenever a trade looks uncomfortable. For a comparison of holding periods and their practical differences, see intraday vs swing vs positional trading.
Advantages and Limitations of Price Action Trading
Potential advantages
- A direct view of price: Traders learn to read the movement of the instrument rather than relying only on a derived indicator value.
- A relatively clean chart: A simple chart can make important swing points and price zones easier to see.
- Flexible across timeframes: The same basic ideas—trend, range, rejection and breakout—can be studied on intraday and longer-term charts.
- Clear trade invalidation: When the setup is defined properly, a trader can identify the price action that would prove the original idea wrong.
Important limitations
- Interpretation is subjective: Two traders may draw different zones or label the same structure differently.
- False signals occur: Breakouts fail, candles reverse and apparent trends can quickly turn into ranges.
- It takes practice: Recognising useful context is harder than memorising candle names.
- Execution still matters: Slippage, spreads, liquidity, transaction costs and overnight gaps can affect results.
- It does not explain everything: A price chart alone may not capture all relevant information about a company, event, derivative contract or sudden market-wide change.
Price action is a way to organise market observations. It is not a guarantee of accuracy, a shortcut to consistent profits or a substitute for learning how the instrument being traded works.
Common Price Action Trading Mistakes to Avoid
- Trading every candlestick pattern: A hammer in the middle of a noisy range does not carry the same context as a rejection candle at a well-observed support zone after a decline.
- Ignoring the higher timeframe: A small bullish setup can run directly into a major resistance area on the broader chart.
- Entering before a candle closes: A candle can look strong while it is forming and finish very differently. Decide in advance whether your rules require a candle close.
- Assuming every breakout will continue: Wait for the confirmation your strategy requires and define what a failed breakout looks like.
- Moving the stop-loss without a plan: Widening a stop just to avoid booking a loss changes the original risk of the trade.
- Using too many timeframes and patterns: Constantly changing the chart can create confusion. Start with a small number of repeatable setups.
- Skipping a trading journal: Without records, it is difficult to distinguish a genuinely useful setup from a few memorable wins.
Frequently Asked Questions About Price Action Trading
1. What is price action trading in the stock market?
Price action trading is an approach that studies a stock’s or index’s price movement over time. Traders analyse candlesticks, OHLC data, swing highs and lows, trends, support and resistance zones, and sometimes volume to plan possible entries and exits.
2. Is price action trading suitable for beginners?
Beginners can learn price action, but it requires practice. Start with candlestick basics, market structure and support and resistance. Practise on historical charts or in a paper-trading environment, and learn position sizing before trading with real money.
3. Can I do price action trading without indicators?
Yes. A clean-chart approach can use price candles, swing structure, support and resistance, and volume without adding indicators such as RSI or MACD. Some traders still use indicators as secondary filters. The key is to understand and test the rules rather than assume that fewer indicators automatically produce better results.
4. Which candlestick pattern is best for price action trading?
No single candlestick pattern is best in every market condition. A Hammer, Shooting Star, Engulfing pattern or Inside Bar should be interpreted in context: where it forms, what the prior trend was, how the candle closes and whether price follows through.
5. What is the best timeframe for price action trading?
There is no universal best timeframe. Intraday traders may study shorter charts, swing traders often use daily charts, and positional traders may focus on weekly or monthly charts. Choose a timeframe that matches the holding period and can be monitored consistently.
6. Is price action trading the same as technical analysis?
Not exactly. Price action is an approach within technical analysis. It places emphasis on direct price movement and chart structure, while technical analysis also includes indicator-based methods and other chart tools.
7. Can price action be used for Nifty and Bank Nifty?
Yes. Traders study price action on index charts as well as individual stocks. However, index derivatives and options have additional features such as contract specifications, liquidity, spreads, volatility and expiry-related behaviour. A chart pattern does not remove those risks.
8. Does price action trading guarantee profit?
No. No chart-reading method guarantees profits. Price action setups can fail, and actual results depend on the market, strategy rules, execution, costs, position size and risk management. Historical examples do not guarantee future outcomes.
Learn Price Action with a Structured Approach
Understanding individual candlesticks is only the starting point. A trader also needs to connect market structure, important price zones, trade planning, stop-loss placement and position sizing into one repeatable process.
Trade4Wealth provides a Stock Market Basics with Price Action course for learners who want to study these concepts in a structured format. Review the current syllabus, course format, fees and support details before deciding whether it suits your learning needs.
Learn the process, practise the setups and manage risk before focusing on the result.
Further Reading and References
The following educational resources provide additional background on technical analysis, chart reading, support and resistance, candlesticks and derivatives risk:
- NSE Academy – Technical Analysis and Chart Patterns for Capital Markets
- Zerodha Varsity – Chart Types
- Zerodha Varsity – Support and Resistance
- Zerodha Varsity – Understanding Candlestick Patterns
- SEBI Investor – Understanding Derivatives
About the Author
Amar Mandekar is a stock market educator and trainer associated with Trade4Wealth Trading Academy. His Trade4Wealth profile provides background on his teaching experience and work in stock-market education.
Disclaimer
This article is for educational and informational purposes only. It is not investment advice, a stock recommendation or a recommendation to buy or sell any security or derivative contract. Trading involves risk of financial loss. Price action patterns and historical examples do not guarantee future results. Consider your financial circumstances, understand the product and its risks, and consult an appropriately qualified professional where required.